Unpacking malware
In this post I’ll show you a common trick used to unpack malware quickly that works with most packers. I used it a lot when I was reversing malware samples every day, so I’ve decided to share it.
Finding a sample
I went to MalwareBazaar’s statistics page to find out what’s most popular nowadays:
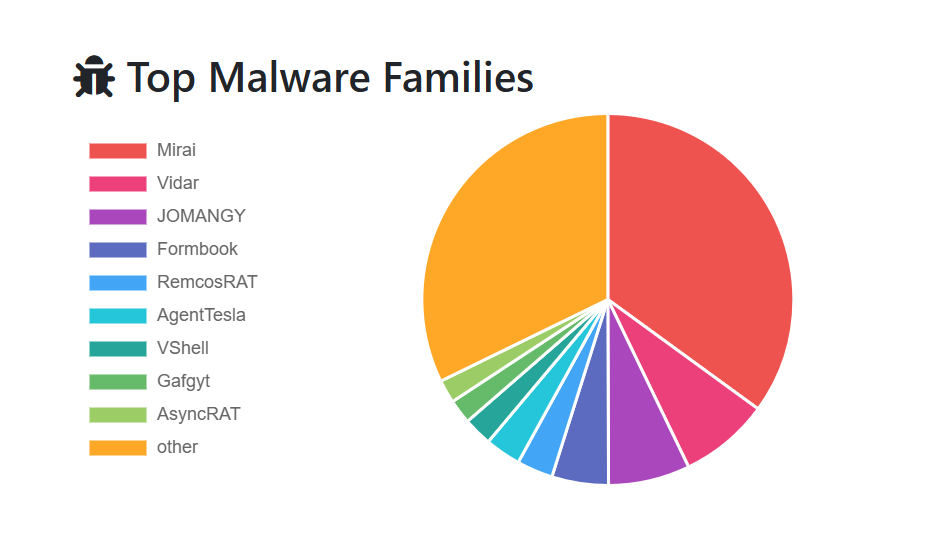
Mirai is #1 - but it’s a botnet that mostly targets IoT / Linux and I’m looking for commodity Windows malware, so I’m picking #2, Vidar, which according to my LLM is:
Vidar is an information-stealing malware that infects Windows systems and collects sensitive data such as saved passwords, browser cookies, cryptocurrency wallet information, and system details.
Looking at its samples page, there’s plenty - great! I chose a random hash tagged exe1 so we can go straight to unpacking: 958f2b36bdddb666f1a635744fac41d16007a667995154a3f0dbd88a3ac95026.
Note that I’ve never looked at this malware family, so I have no previous knowledge of it and will be going through it for the first time with you along the post.
First look
Dropping the sample into IDA we see the entry point:
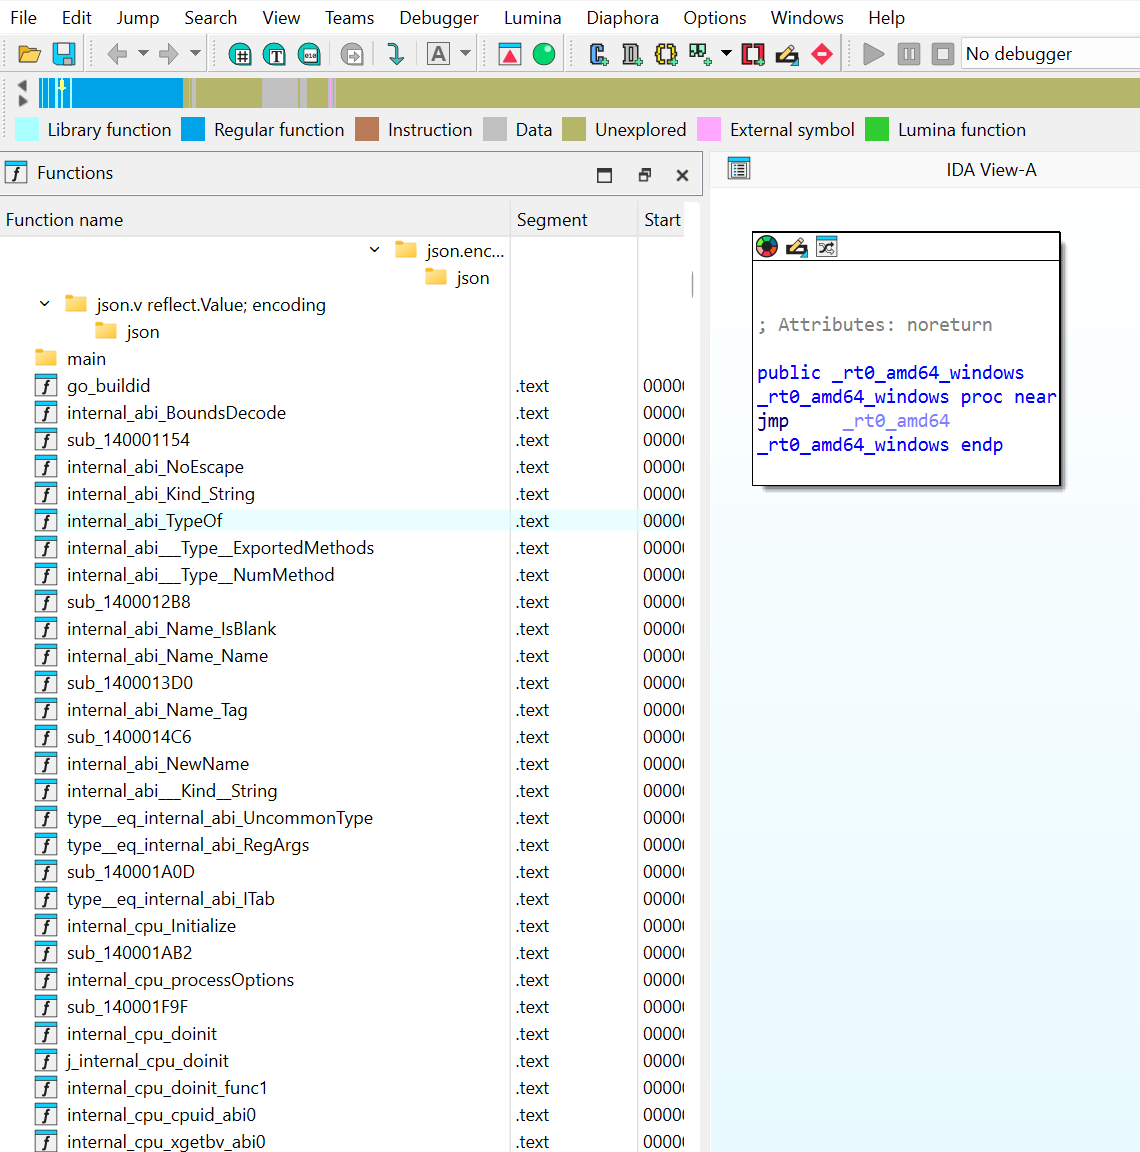
Immediately this strikes me as Go. Googling the entry point’s name shows:
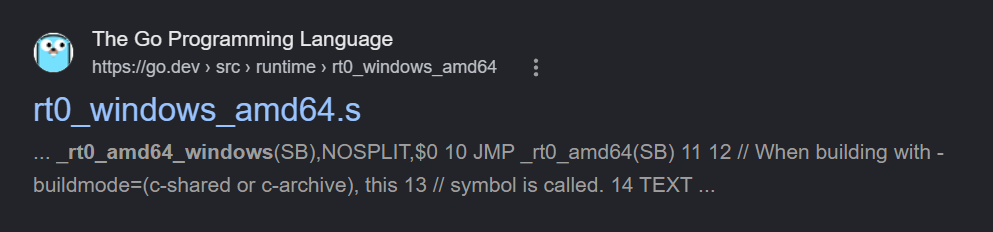
…confirming that the sample is written in Go. Following through the library code and arriving at runtime.main() shows a call to main_main(), presumably the actual main function of the Go code:
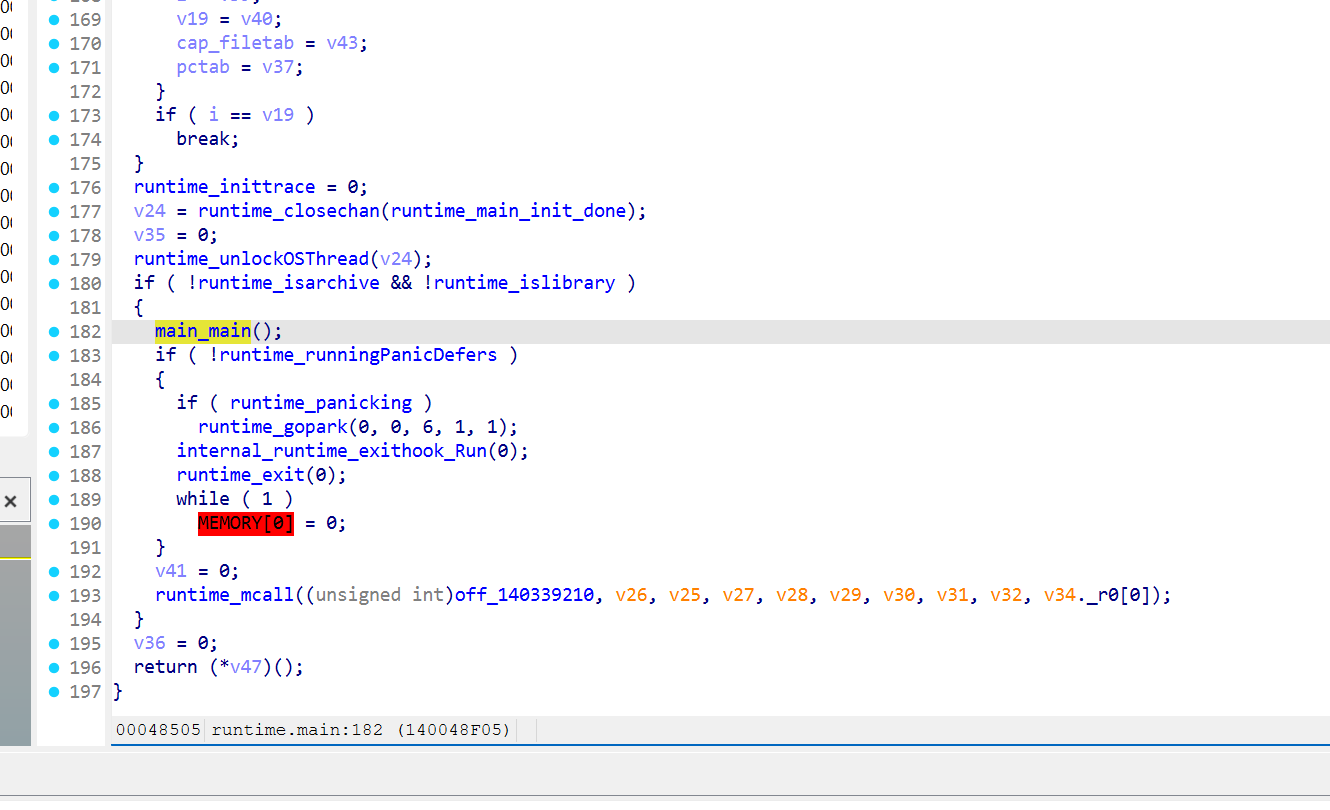
However, decompilation for that function doesn’t work:
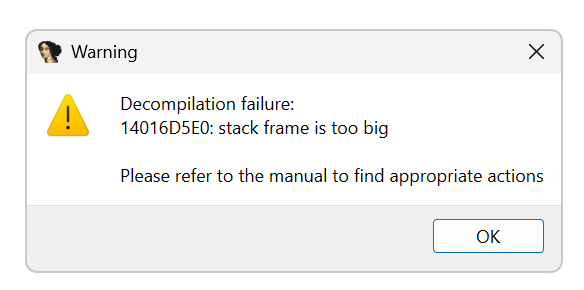
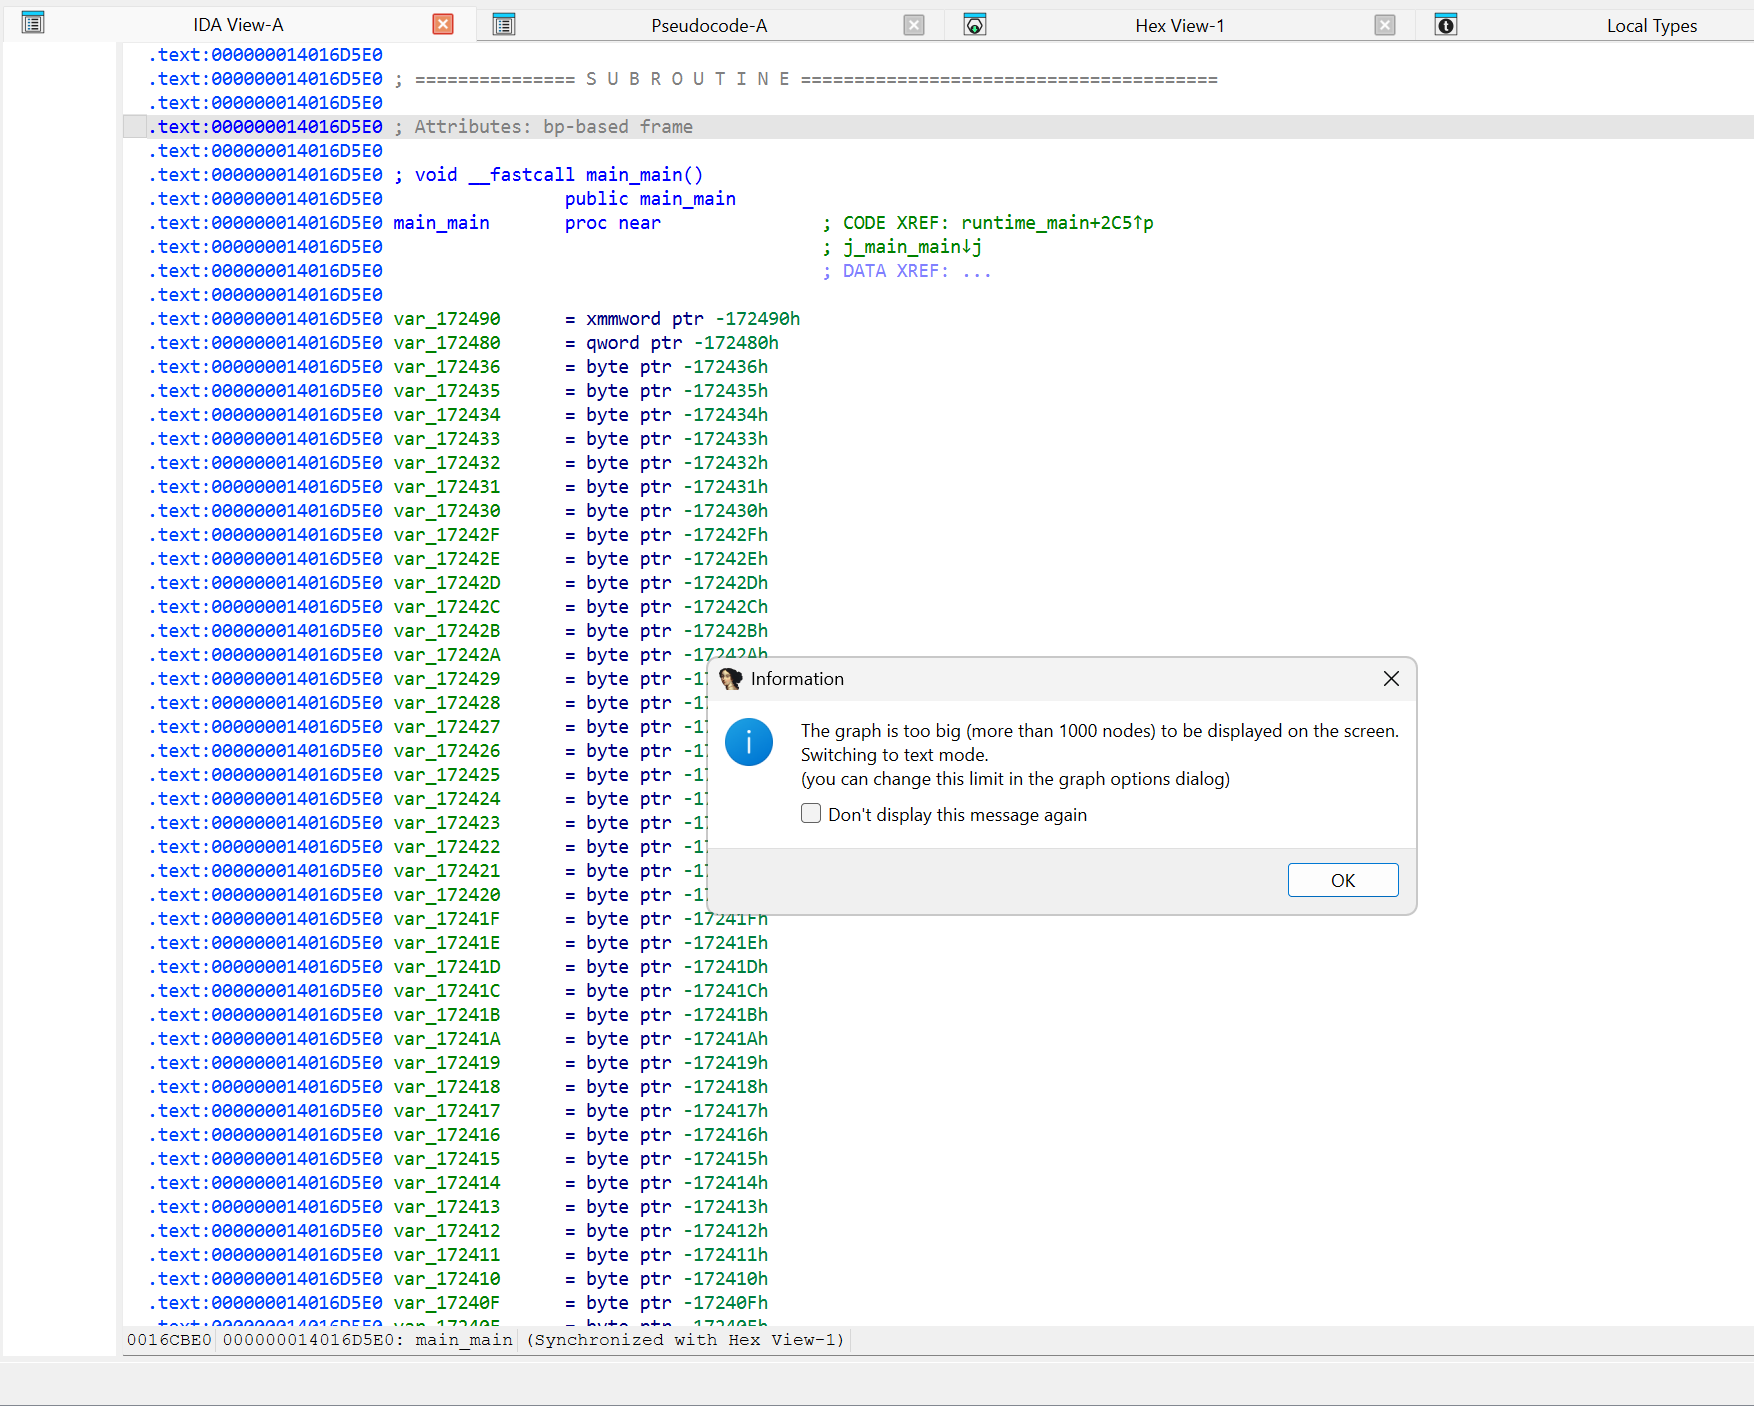
Normally, the “stack frame too big” error means that IDA incorrectly parsed the stack pointer-manipulating instructions either because of an analysis mistake, or because the sample is intentionally written to be confusing, so we’d have to go into assembly / graph mode, trace the stack pointer, find where it gets borked, and fix it. But here, I couldn’t even go into graph view:
I tried increasing the maximum graph size to 2000, 3000, and even 5000 nodes, but it still errored out saying it’s too big! I only got the graph to show up by setting the maximum number of nodes at 10k. That’s a lot:
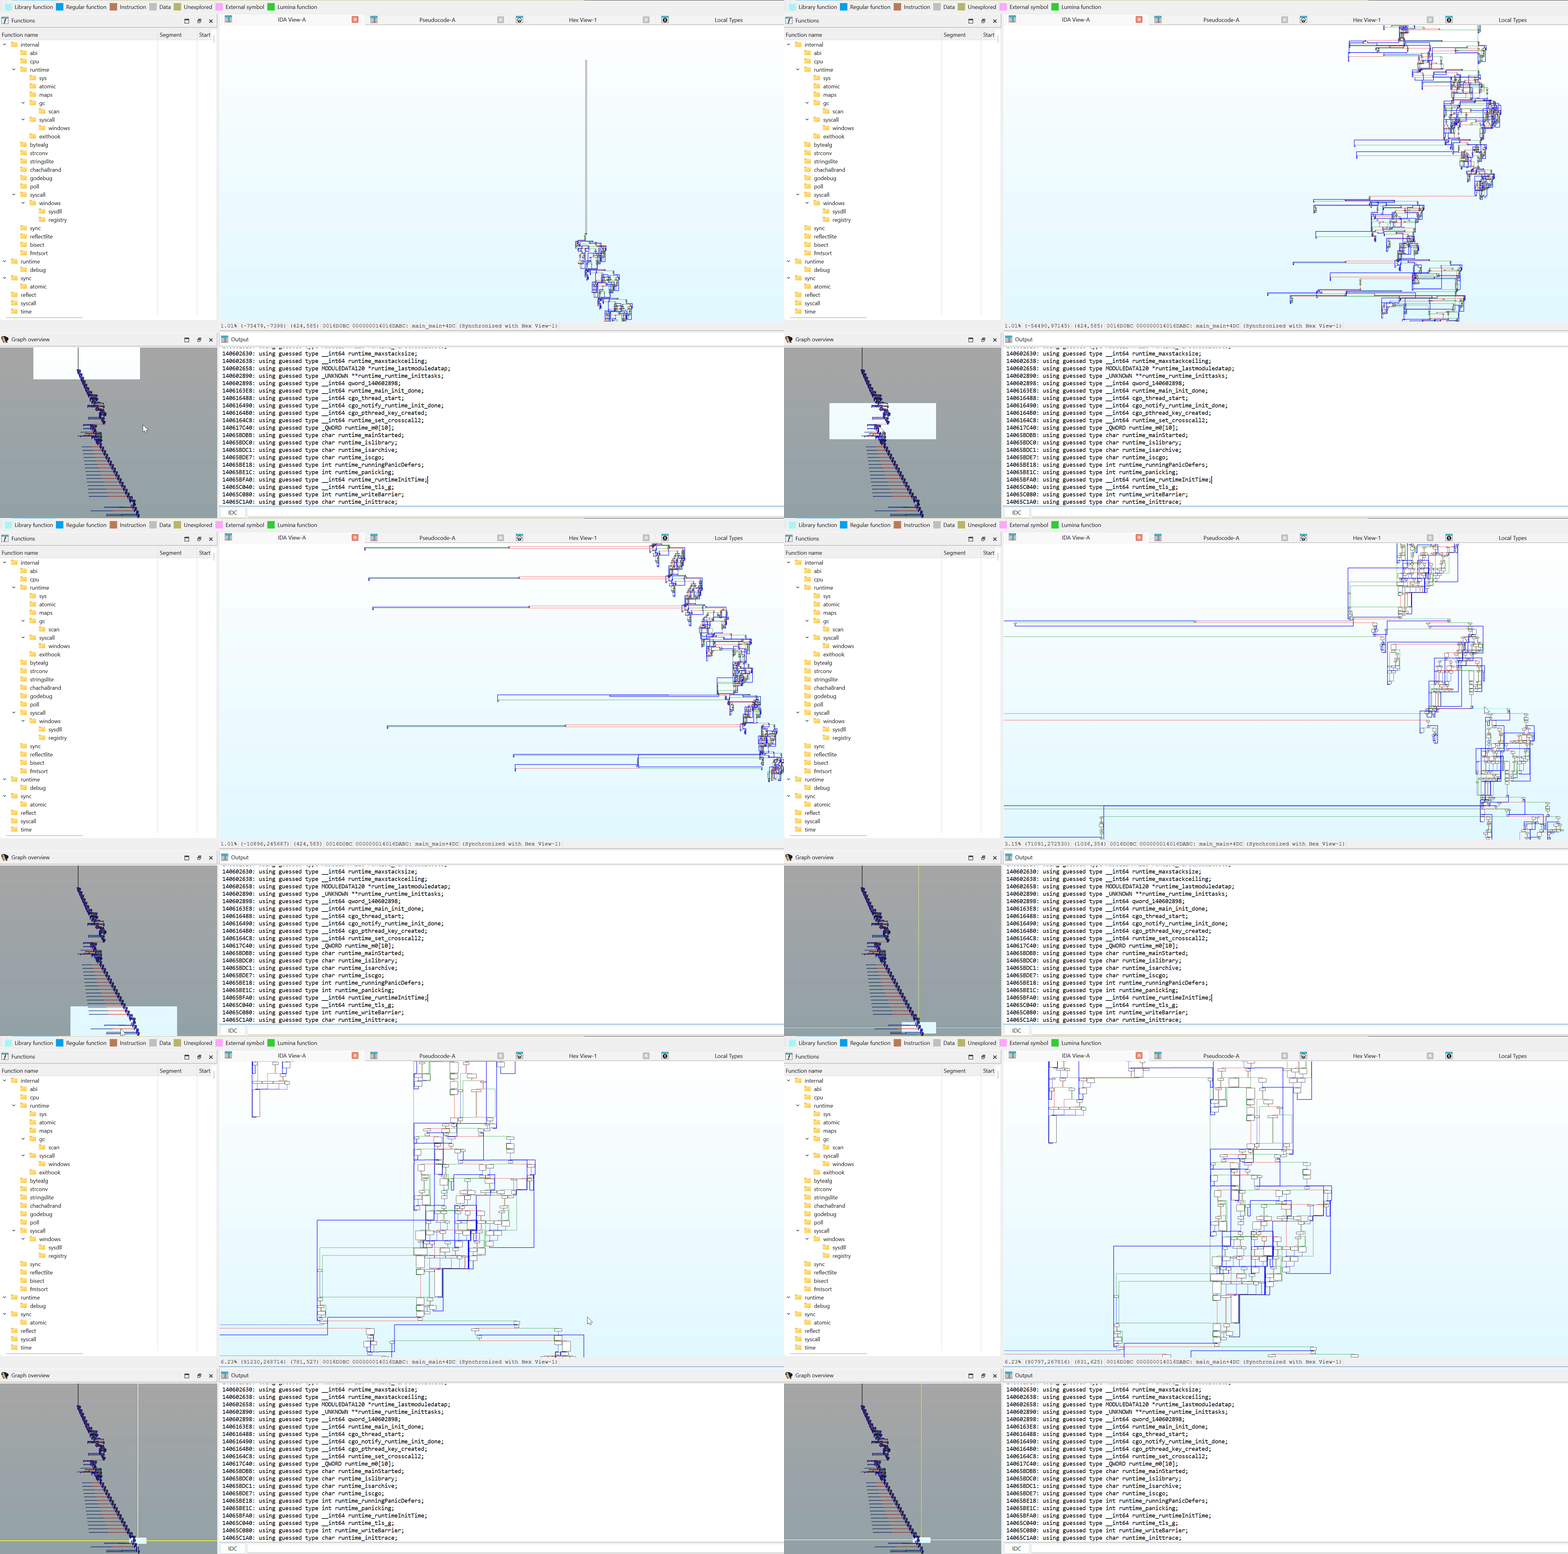
Big functions exist, and Go can inline a lot of code - but malware is almost always packed, and packers often inflate function size with either meaningless or entirely invalid instructions to make analysis harder. Here, the shape and patterns of the graph look semi-credible in that it’s not a completely messed up graph with dangling nodes, but it also doesn’t look a lot like regular code. Furthermore, browsing online, there are multiple blog posts claiming Vidar to be written in C/C++, not Go, so let’s attempt to skip all the fluff and try to unpack directly.
Unpacking technique
To unpack itself, malware generally needs to either:
- Allocate a new writable page, write to it, then make it executable, or
- Allocate a new writable + executable page and write to it
…and then jump to the newly unpacked code and run it.
There’s no universal way of telling IDA “put a breakpoint wherever you see a jmp malware_oep to catch the malware right before execution”, but we can do the next best thing: put a breakpoint on the allocation / protection functions to catch the page where the unpacked malware will be written. Notice that we’re looking for executable pages, as the code has to run after being unpacked. We can do this with conditional breakpoints:
- BP on
NtAllocateVirtualMemory, breaking only when the requested page protection type is executable (parameterULONG Protect), and - BP on
NtProtectVirtualMemory, breaking only when the new protection type is executable (parameterULONG NewAccessProtection)2
For the condition expressions, I used:
# NtAllocateVirtualMemory(a1, a2, a3, a4, a5, Protect)
# 6th parameter in __fastcall convention is in rsp+0x30
bool(get_wide_dword(get_reg_value("RSP") + 0x30) & 0xF0)

# NtProtectVirtualMemory(a1, a2, a3, NewAccessProtection, a5)
# 4th parameter in __fastcall convention is in r9
bool(idc.get_reg_value("r9") & 0xF0)

# Executable page flags:
#
# 0x10 -> PAGE_EXECUTE
# 0x20 -> PAGE_EXECUTE_READ
# 0x40 -> PAGE_EXECUTE_READWRITE
# 0x80 -> PAGE_EXECUTE_WRITECOPY
#
# 0xF0 == (PAGE_EXECUTE | PAGE_EXECUTE_READ |
#          PAGE_EXECUTE_READWRITE | PAGE_EXECUTE_WRITECOPY)
I put a breakpoint on the entry point and ran the sample. Once there, I put the conditional breakpoints on the syscalls (named ntdll_Nt* in IDA), and let it run.
The first hit was attempting to make some advapi32 code executable, so I ignored it and continued. The next one landed on NtAllocateVirtualMemory:
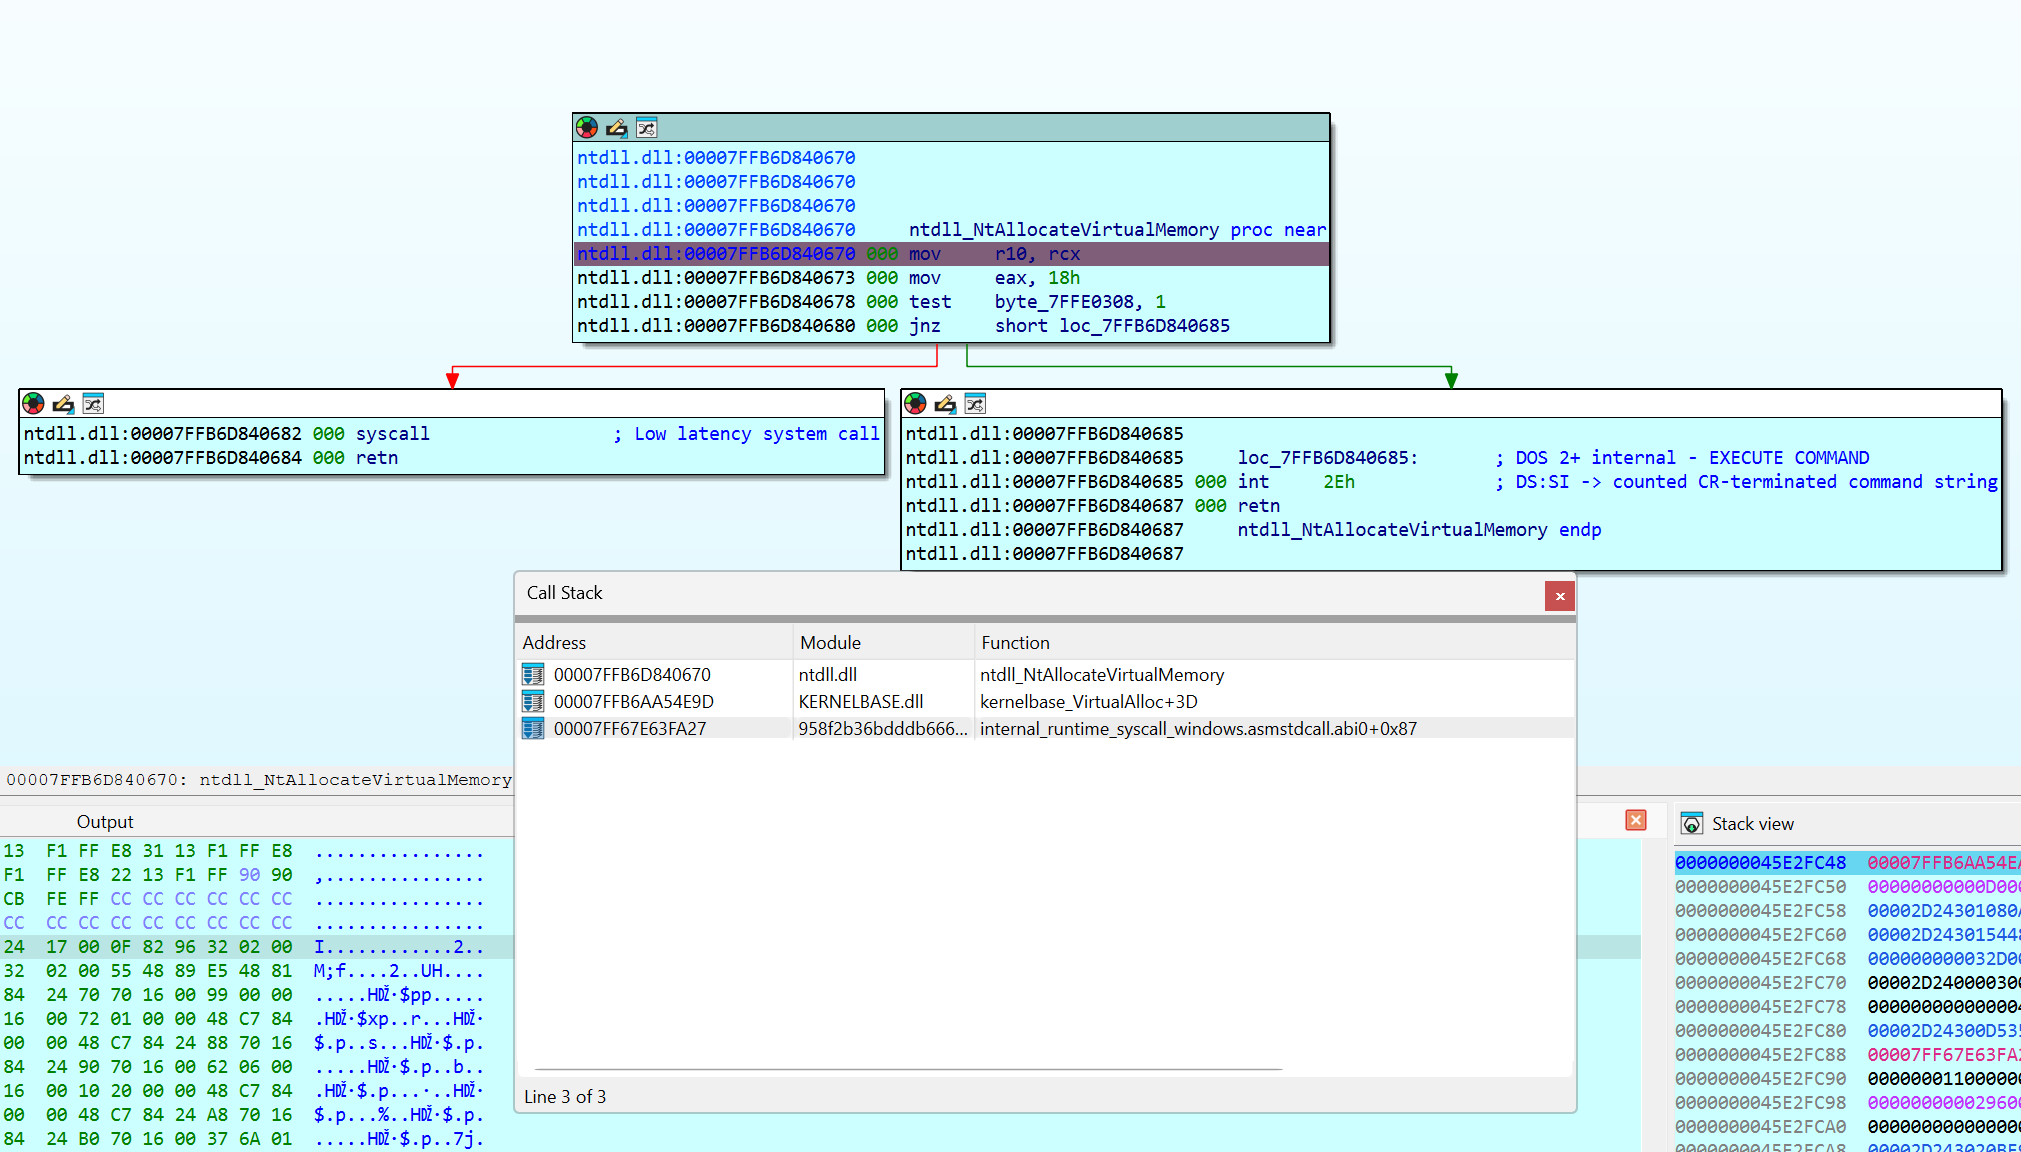
The stack trace shows that the call is coming from user code (internal_runtime_syscall_windows.asmstdcall.abi0 is a Go library function), so it’s possible this is the call we’re looking for. I stepped through the code and noted the address of the newly allocated page, 0x0000000110000000, and looked at it in the Segments (Ctrl + S) view:
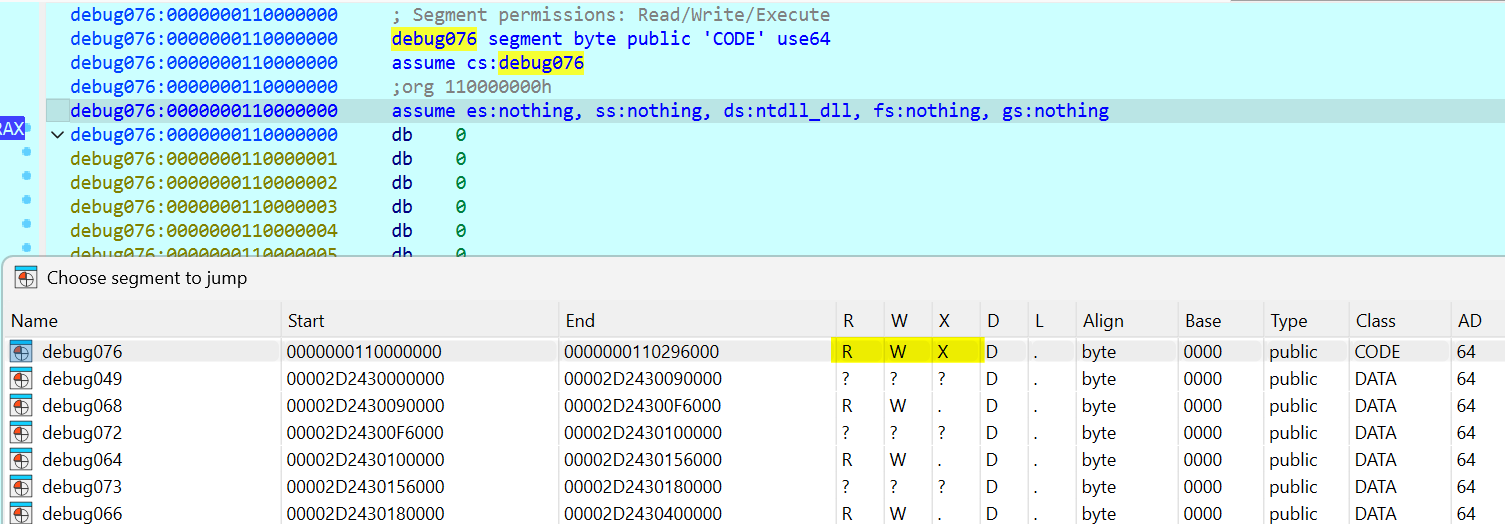
The page is still empty, but as you can see it’s RWX (readable, writable, executable), so presumably it’ll be written to and executed.
Note that to write the final unpacked code, you need some sort of loop, e.g.:
// Pseudocode

// Write unpacked code to target memory page
code = get_unpacked_code();
for (int i = 0; i < code->len; i++) {
    new_page[i] = code->buf[i];
}

// Jump to it
jump_to(new_page);
To catch the loop right before the jump to the unpacked code, we can set a hardware breakpoint on write somewhere on the page:
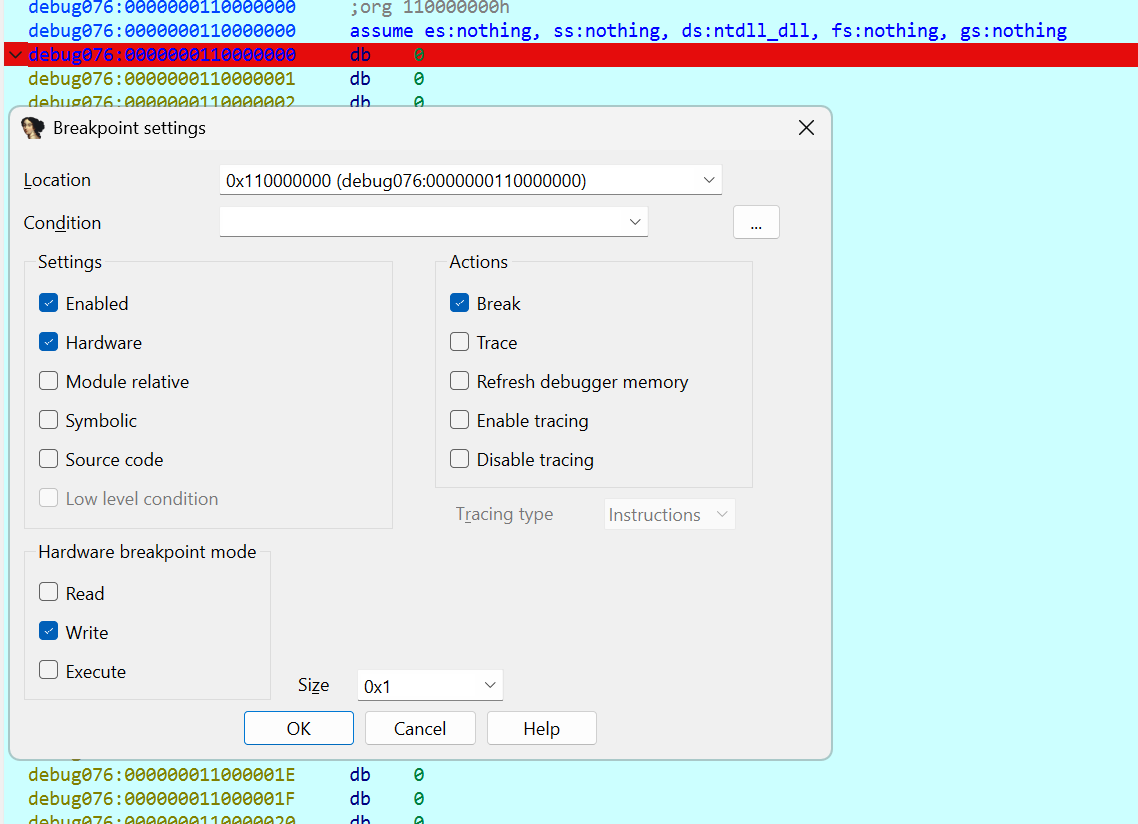
Press F9 to run, and we see this immediately:
In this case, we end up at runtime_memclrNoHeapPointers, which is a Go library function that zeroes out a bunch of memory:
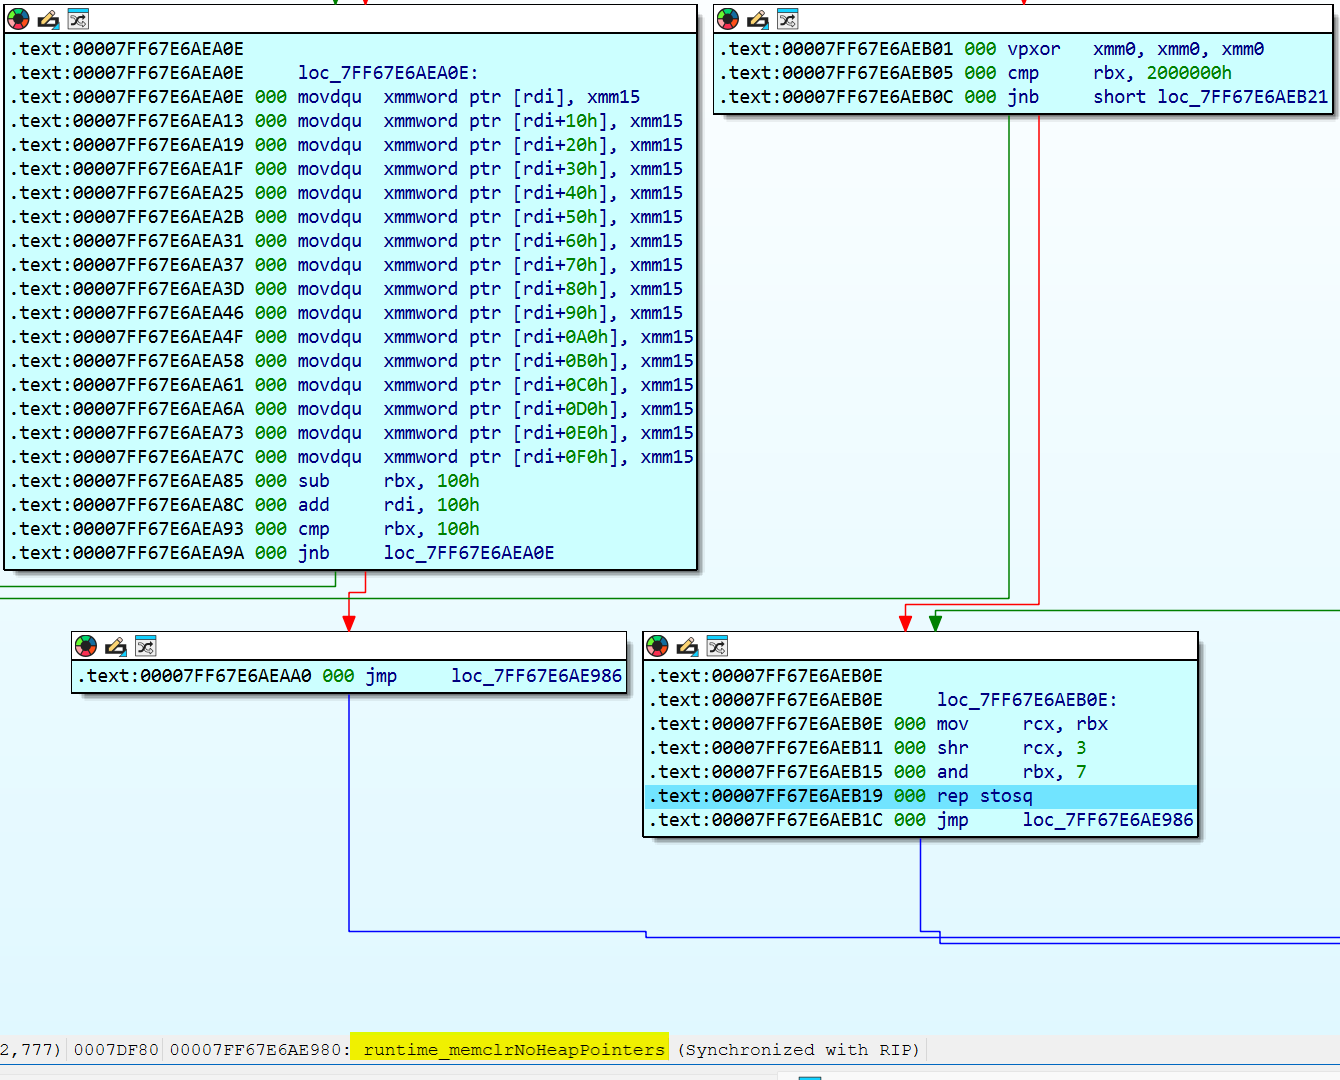
This is just zeroing out the newly allocated page - still no evidence of unpacked malware. But it might come soon, so let’s run again: the breakpoint triggers again, and this time, we see:

A call to runtime_memmove - could this be it? Let’s check the allocated page:
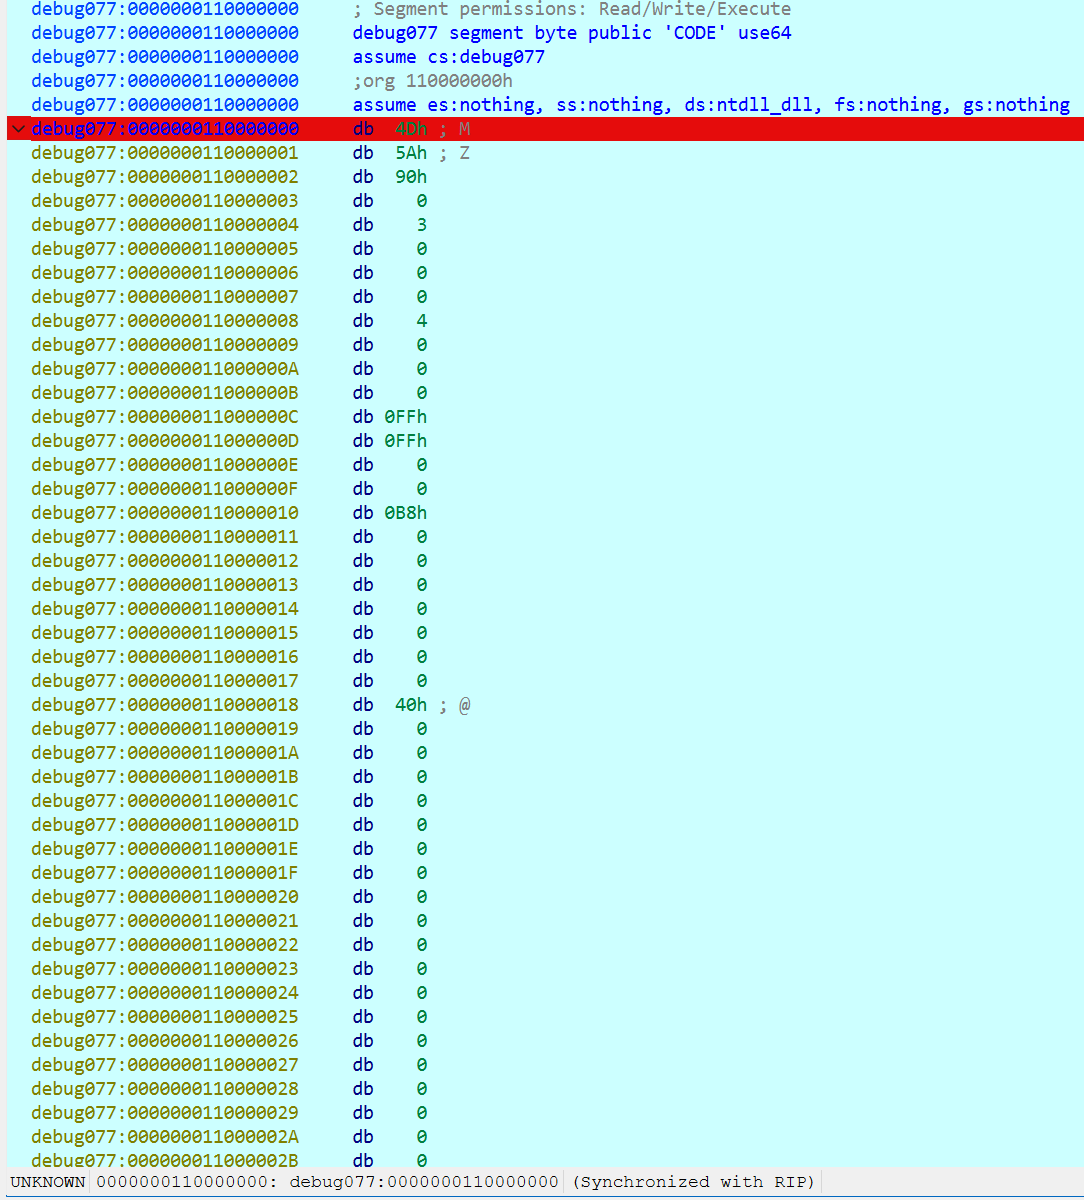
Here we see the MZ header, which is in fact the unpacked (or next stage) binary. Here we can just dump it out with any PE dump tool, and analyze it statically:
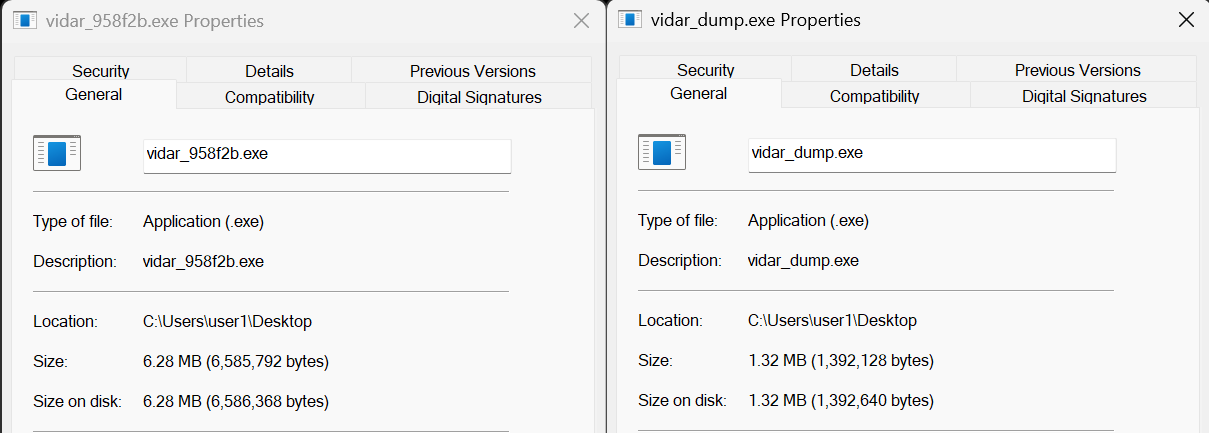
On the left is the original ~6.3MB binary, on the right the dumped ~1.3MB binary.
Over 1MB could still be indicative of further obfuscation or packing, but that’s for another post - here, we’re done unpacking this layer.
Conclusion
Most packers are lazy loops that decode the payload, allocate a new page, write to it, then execute it - so why spend time reversing and trying to understand them? We can just cut directly to the payload.
That’s it for this post - hope you found the technique useful.
-
There are other sample types that are non executable - those are usually documents or other file types used for the delivery of the actual malware, containing some sort of technical or social engineering-style trick to get the victim’s machine to execute malicious code. ↩︎
-
Note that there’s also
NtAllocateVirtualMemoryEx, section mapping, and other ways to place the unpacked malware in executable memory, but the idea is the same: catch the target memory region at the syscall level. ↩︎